Performance Reporting
The Performance Reporting component of TheBooks provides both real-time, intra-day performance and risk reporting, valued on the tick, historic reporting as well as standard performance tables. All reports are delivered via a web-browser interface and can be requested in PDF, Excel®, Word®, HTML, and raw data formats.
The Performance Reporting module of TheBooks bases its calculations on positions from the Position Management component of TheBooks. Trades come from the Order Management component of TheBooks.
The system performs position netting and re-values positions using a real-time data feed such as those provided by DTN or CQG.
The Performance Explorer™
The Performance Explorer is an interactive, graphical performance analysis tool that allows you to review performance for a portfolio or a subset of the portfolio and drill down into the sector and market components of the P&L. The user interface allows drill-down by simply clicking on the area of a chart to cause it to expand and show the underlying details. You can select arbitrary time frames and examine the effects of removing markets, accounts, or entire sectors from the portfolio over the selected time. Daily and compounded returns are re-calculated and the charts are updated to reflect your changes. You can also overlay one or more benchmarks to show how the selected portfolio performed compared to the benchmarks. All data and charts can be copied to other applications for further analysis or publication.
Counter Party Reporting
Any report can be configured to be sent to any contact in any available format automatically on a daily, monthly, and annual basis. Using a few mouse clicks, you can configure what reports, in what format, are to be sent to what contacts and what account's are to be included in the reports.
End-user Report Designer
TheBooks includes an end-user report designer that provides an easy to use, drag and drop environment that allows non-technical users to design tabular and graphical reports specific to the needs of the organization. These reports can be integrated into TheBooks reporting menus and can be displayed and distributed just as any other report.
Program Tear Sheet
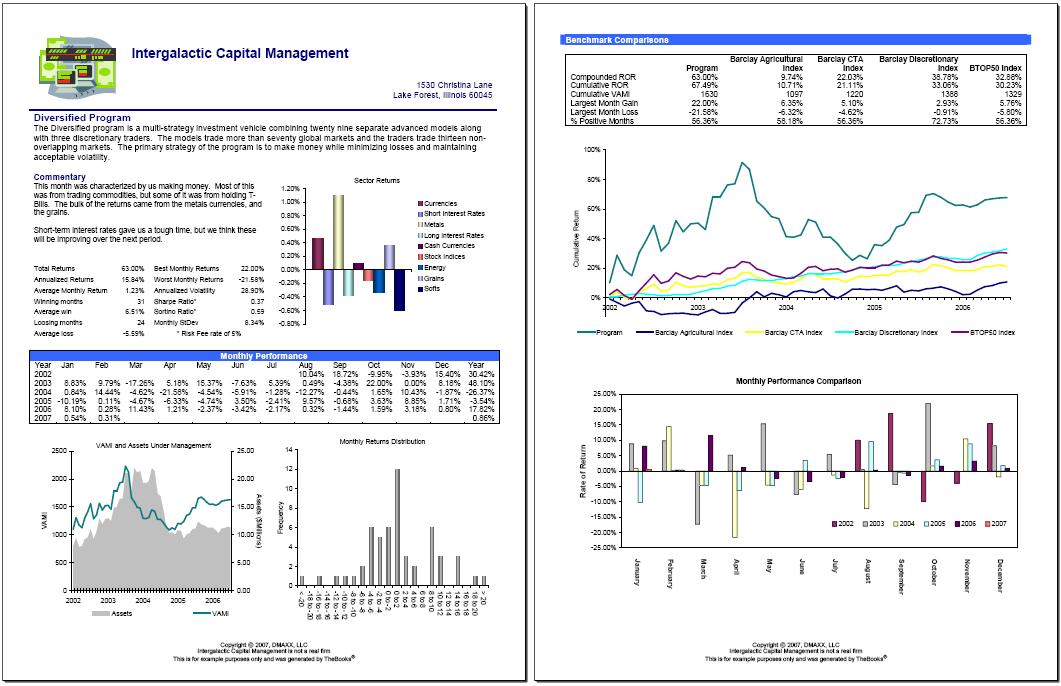
One of the more time-consuming tasks for a CTA is the production of the summary that is mailed each month outlining their programs. The production of the performance statistics, comparison benchmarks, and other information contained in the document often requires hours of preparation.
TheBooks® includes a template monthly summary that automates the production of this critical piece of marketing documentation.
The author designs the document layout and styles to fit the organization's requirements and can select from seven different charts and tables to be included in the document. These include benchmark comparisons with a selection of the eight industry-wide Barclay indices as well as user-defined benchmarks.
Once the author is satisfied with the layout and styles used in the document, TheBooks® will populate the selected tables and charts with the required information.
By saving the layout for use in subsequent documents, the production of the summary simply a matter of adding the commentary and having TheBooks® populate the document with the latest statistics and data.
Intranet and Internet Reporting
For the CTA with a permanent Internet connection, the reports can be delivered directly to clients using a secure connection. With a few clicks of a mouse, you can configure the Performance Reporting module of TheBooks to allow you or your clients to view account activity and performance over the Internet.
To ensure your data stays secure when delivering data over the Internet, TheBooks utilizes a multi-level approach to delivering data. This ensures that your data stays secure.
A sampling of available reports
| Performance Summary | Shows open trade equity, the period's change in unrealized P&L, the period's realized P&L, and the period's total income - by sector. |
| Instrument Summary | Shows open trade equity, the period's change in unrealized P&L, the period's realized P&L, and the period's total income - by market grouped by sector. |
| Instrument Returns by Direction | Shows open trade equity, the period's change in unrealized P&L, the period's realized P&L, the period's total income and returns - grouped by sector, by direction (Long/Short) |
| Performance Detail | Shows open trade equity, the period's change in unrealized P&L, the period's realized P&L, and the period's total income by sector, for each account. |
| Positions | Shows net positions by market grouped by sector. |
| Account Margin | Shows net positions, open trade equity, dollar margin, and risk margin - by market grouped by sector, for each account. |
| Margin to Equity | Shows dollar margin and risk margin by account. It also provides an indicator if the account's risk margin has exceeded a pre-set limit for the account. |
| Account Detail | Shows open trade equity, the period's change in unrealized P&L, the period's realized P&L, and the period's total income - by market grouped by sector for each account. |
| Account Summary | Shows open trade equity, the period's change in unrealized P&L, the period's realized P&L, and the period's total income for each account. |
| Account Income | Shows the period's total income for each account. |
| Trade Blotter | Shows trading activity highlighting any market/sector violations. |
| Trading Activity | Shows trading activity for a specified date range including a commission summary. It is similar to the information contained on a month-end equity run from an FCM. |
| Slippage | Shows dollar valued and average tick slippage from stop or market level broken down by market by executing broker. |
| Win/Loss Review | Shows trading win / loss statistics by sector and market for a selected group of accounts. |
| Round-Turns | Shows round-turns per million of equity or of trading size both as an aggregate as well as by market and sector. |
| Fully Funded Subset | Shows performance using the Fully-Funded Subset method providing several levels of detail (Summary, Capsule, Detail). |
| Daily Compounded Returns | Shows performance using the Compounded Returns method providing several levels of detail (Summary, Capsule, Detail). |
| Monthly Compounded Returns | Shows monthly performance using the Compounded Returns method providing several levels of detail (Summary, Capsule, Detail). |